Bernard Murphy Published on 03-14-2017 05:00 AM
| Unless you've been in hibernation for a while, you probably know that a lot more chip design is happening in system companies these days. This isn’t just for science experiments; many of these designs are already being used in high-value applications. This development is captive - systems companies generally don’t want to get into selling chips – but there is enough value in their own needs for them to justify the design and manufacture of these parts. |  |
An important motivation is for differentiated enhancements in cloud hardware. Cloud services are a very hot and competitive area; one estimate puts Amazon Web Services, considered standalone, as the 6th largest business in the US. Which is good news for cloud services providers and for those who sell hardware and software solutions to those providers. Climbing fast on this list is a Chinese company called Inspur. I’m guessing you’ve never heard of them. That may change; they’re a vertically integrated company, with offerings all the way from cloud services down to building and selling servers. In server sales, they rank 5th worldwide and top in China. Which makes them very interested in anything that can improve QoS for cloud applications.
Networking between servers is an especially hot domain for differentiation. Microsoft recently announced their work with Intel/Altera to optimize networking for Azure through software-defined networking on reconfigurable platforms. Inspur is working on their own routing control chip (details not available) and unsurprisingly they want to prototype it, presumably in-system, before they commit to silicon.
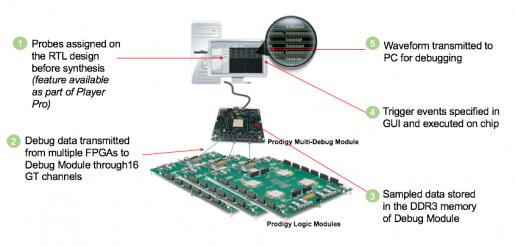
Inspur chose S2C for their prototyping solution because they wanted to be able to inspect and validate correct behavior in operation, while making high volume/throughput packet transmissions. In particular, S2C's Prodigy MDM (Multi-Debug Module) is being used to set trigger conditions and capture related packets for chip debug. Deep sampling depth supported by Prodigy MDM allows Inspur to grab as many packets as possible to then be analyzed for correctness.
Inspur cited especially the strength and ease of debugging across a multi-FPGA prototype in the Prodigy solution. Large designs (and routing controllers tend to be large) are unlikely to fit on a single FPGA and may have to span to multiple boards. But from the designer’s point of view, that’s an implementation detail; they still want to observe and debug across the whole design, unimpeded by FPGA partition boundaries. Using traditional FPGA tools, you would have to debug each FPGA in isolation; problems spanning more than one FPGA become painful to trace to a root-cause. Fixes are even more challenging – a fix on one FPGA, made without a clear perspective on behavior in the rest of the design, may create a new problem on another FPGA.
The Prodigy MDM solution addresses this fundamental problem in multi-FPGA debug by presenting a unified design view across 4 Prodigy logic modules (boards) simultaneously. When you setup probes and trigger conditions, they are based on the design and indifferent to partitioning. When you view waveforms, the same applies. The designer sees the design as a whole and can monitor and debug it as a whole – the FPGA implementation is transparent.
Inspur also mentioned that deep tracing support was very important to speeding up their debug process. They needed to grab as many packets as possible when looking for potential problems and this can only be accomplished at reasonable speed if trace data can be buffered into sizeable on-board memory. To get at the details of those packets, Prodigy MDM supports many more probes on each FPGA than you are likely to need (and you can precompile up to 16k probes per FPGA, from which you can select and change candidates for tracing without needing to recompile). MDM can then store up to 16GB of probe traces on the MDM hardware, again a significant differentiator from traditional FPGA debug tools which offer limited internal memory to capture traces. Tracing supports speeds up to 40MHz and transfer to a host computer is accomplished through a high-speed Gigabit Ethernet interface.
Compile, probe setup, run-time control and debug are all steered though the Prodigy Player Pro cockpit, so you have one unified interface for ease of use. You can learn more about Prodigy MDM HERE, the complete Prodigy line (including support for logic boards based on a variety of FPGA options) HERE and you can read the joint S2C/Inspur press release HERE.


This site uses cookies to collect information about your browsing activities in order to provide you with more relevant content and promotional materials, and help us understand your interests and enhance the site. By continuing to browse this site you agree to the use of cookies. Visit our cookie policy to learn more.


-383.png)